URM/NURM Rates
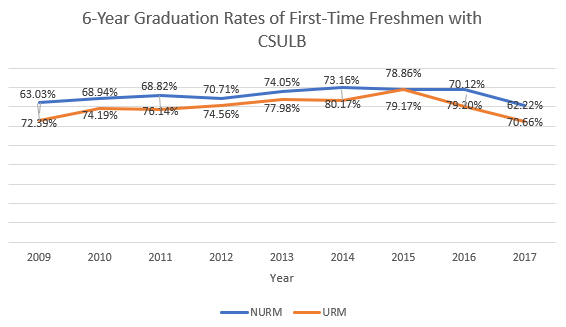
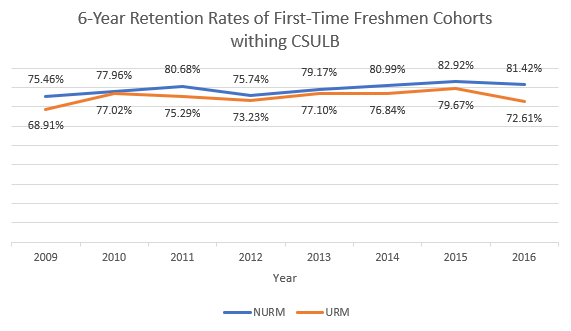
Six Year First Time Freshmen / Cohorts within CSULB
|
6-Year |
NURM |
URM |
|---|---|---|
|
2017 |
70.66% |
62.22% |
|
2016 |
79.20% |
70.12% |
|
2015 |
79.17% |
78.86% |
|
2014 |
80.17% |
73.16% |
|
2013 |
77.98% |
74.05% |
|
2012 |
74.56% |
70.71% |
|
2011 |
76.14% |
68.82% |
|
2010 |
74.19% |
68.94% |
|
2009 |
72.39% |
63.03% |
|
Cohort Year |
NURM |
URM |
|---|---|---|
|
2016 |
81.42% |
72.61% |
|
2015 |
82.92% |
79.67% |
|
2014 |
80.99% |
76.84% |
|
2013 |
79.17% |
77.10% |
|
2012 |
75.74% |
73.23% |
|
2011 |
80.68% |
75.29% |
|
2010 |
77.96% |
77.02% |
|
2009 |
75.46% |
68.91% |
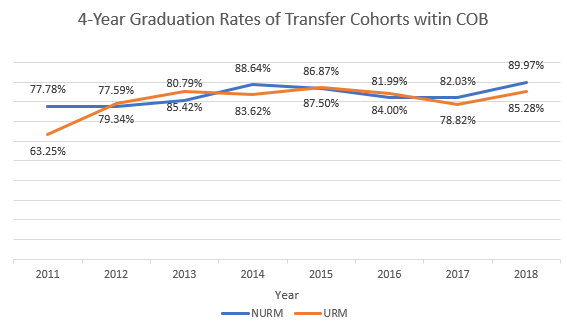
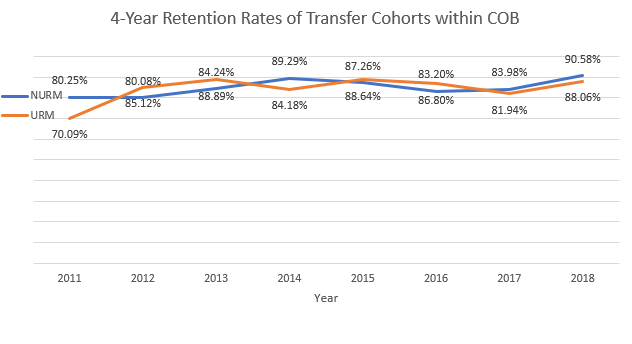
Four Year Rates of Transfer Cohorts within College of Business CSULB
|
Cohort Year |
NURM |
URM |
|---|---|---|
|
2018 |
89.97% |
85.28% |
|
2017 |
82.03% |
78.82% |
|
2016 |
81.99% |
84.00% |
|
2015 |
86.87% |
87.50% |
|
2014 |
88.64% |
83.62% |
|
2013 |
80.79% |
85.42% |
|
2012 |
77.59% |
79.34% |
|
2011 |
77.78% |
63.25% |
|
Cohort Year |
NURM |
URM |
|---|---|---|
|
2018 |
90.58% |
88.06% |
|
2017 |
83.98% |
81.94% |
|
2016 |
83.20% |
86.80% |
|
2015 |
87.26% |
88.64% |
|
2014 |
89.29% |
84.18% |
|
2013 |
84.24% |
88.89% |
|
2012 |
80.08% |
85.12% |
|
2011 |
80.25% |
70.09% |
.