What's New in Beach Data
Click on the topics below to view dashboards containing CSULB institutional data. Click on dashboard images for At-A-Glance views. Click on topic for additional data.
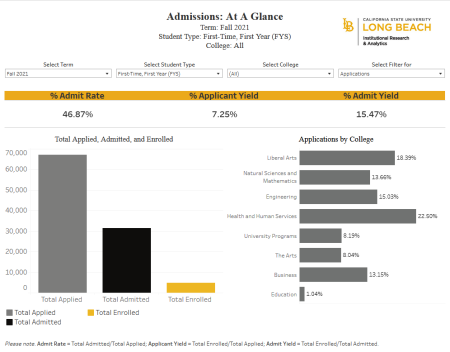
Admissions
CSULB Application Data on Undergraduate and Graduate Students.
Enrollment
The Campus Enrollment includes Head Count, Full-Time Equivalent Students (FTES), and Average Unit Load (AUL) of CSULB students at the College and Department level with the ability to look at the data for certain demographic characteristics.
Grades
The Grades Data section contains CSULB term grades (A, B, C, D, F, I, W, WU, CR, NC, AU, RP), count and percent distributions at the College Level with Class Characteristics. Low performance grades (i.e. D, F, WU/U, NC) is a key performance indicator for Low Completion Classes. For a complete explanation of grade definitions please refer to the Academic Regulations.
Faculty
The Faculty Data section contains faculty Head Count, Full-Time Equivalent Faculty (FTEF) and Tenure Density Statistics of CSULB faculty at the College and Department, Sub-department level. The dashboards present faculty data and parameters by several dimensions such as Race/Ethnicity, Sex and Education Level.
Student Success
This webpage contains information on key success metrics for many of the most recent cohorts of freshmen students, transfer students as well as fifth semester students who initially enrolled as freshmen. Previous versions of all IR&A student success dashboards can be found in the archives, linked at the bottom of the page.
Degrees & Graduation Rates
The Predicted Graduation Rate Dashboards align with Graduation Initiative 2025 and are intended not only to show historical graduation rates, but to be an early indicator (before degrees are final) of GI2025 progress with graduation rate goals for the current academic year.
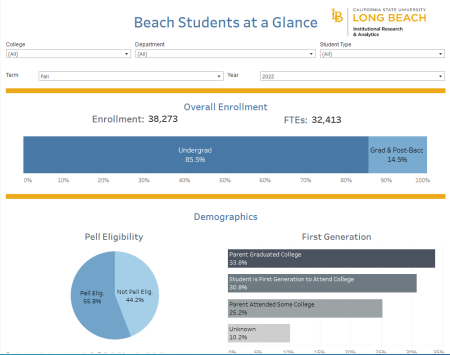
The Campus Enrollment includes Head Count, Full-Time Equivalent Students (FTES), and Average Unit Load (AUL) of CSULB students at the College and Department level with the ability to look at the data for certain demographic characteristics.
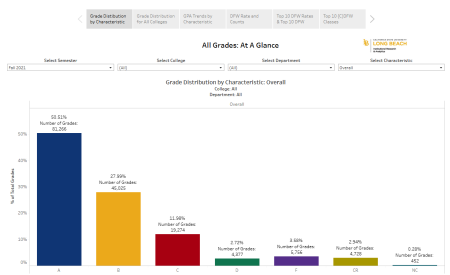
The Grades Data section contains CSULB term grades (A, B, C, D, F, I, W, WU, CR, NC, AU, RP), count and percent distributions at the College Level with Class Characteristics. Low performance grades (i.e. D, F, WU/U, NC) is a key performance indicator for Low Completion Classes. For a complete explanation of grade definitions please refer to the Academic Regulations.
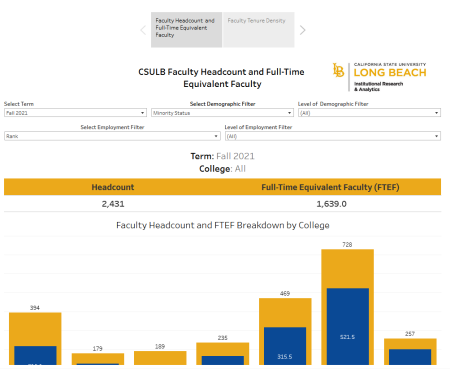
The Faculty Data section contains faculty Head Count, Full-Time Equivalent Faculty (FTEF) and Tenure Density Statistics of CSULB faculty at the College and Department, Sub-department level. The dashboards present faculty data and parameters by several dimensions such as Race/Ethnicity, Sex and Education Level.
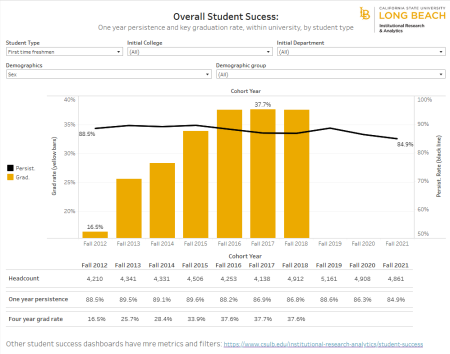
This webpage contains information on key success metrics for many of the most recent cohorts of freshmen students, transfer students as well as fifth semester students who initially enrolled as freshmen. Previous versions of all IR&A student success dashboards can be found in the archives, linked at the bottom of the page.
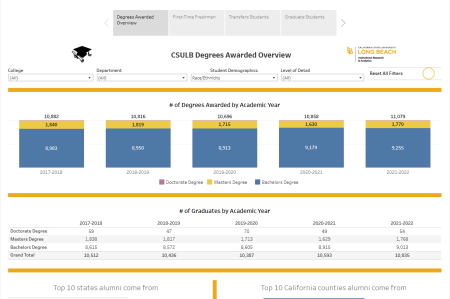
Degrees & Predicted Graduation Rates
The Predicted Graduation Rate Dashboards align with Graduation Initiative 2025 and are intended not only to show historical graduation rates, but to be an early indicator (before degrees are final) of GI2025 progress with graduation rate goals for the current academic year.

PARC dashboards are intended for use when completing the Program Review Report. This series of dashboards contains data on admissions, enrollment, graduation, and degrees awarded for First Time Freshmen, Transfers, and Graduate Programs. Data can be filtered by college, department and major.


This section contains a variety of information about our students, including admissions, enrollment, student success and graduation. All dashboards show student demographics (like sex, ethnicity and first generation status) and have filters for college and department.

The Common Data Set (CDS) is a set of standards and definitions of data items rather than a survey instrument or set of data represented in a database. Each of the higher education surveys conducted by the participating publishers incorporates items from the CDS as well as unique items proprietary to each publisher. Consequently, the publishers' surveys differ in that they utilize varying numbers of items from the CDS.

Institutional Research and Analytics
E-mail: ir&a@csulb.edu