
Introduction

There are two different approaches to measuring an earthquake's severity: magnitude and intensity. Magnitude measures (including the Richter scale) express the energy released in an earthquake; intensity measures (the Modified Mercalli Intensity scale) express an earthquake's severity in terms of more subjective overall impacts on human beings, their assets, and the physical environment.
Isolines are any line on a map connecting places having the same value of "something or other," such as parallels and meridians (latitude and longitude, respectively), contour lines (elevation), isotherms (temperatures), isohyets (precipitation), "isodobsons"(ozone concentrations).
In this lab, you construct your own isoline map, one based on the Modified Mericalli Intensity Scale. The isoline involved is called an "isoseism" and the map you'll make is called an "isoseismal map." An isoseism encloses all places having the same level of intensity of shaking and damage, as reported by people who fill in a survey for the USGS or other earth science agency about their experiences (or lack of experiences).
What you'll do is print out a copy of a map showing earthquake intensity reports in the wake of the local magnitude 5.6 earthquake in North Palm Springs back on the 8th of July of 1986. Then, you'll examine the pattern of earthquake intensity reports by location and pencil in isoseisms enclosing all areas reporting a 7, a 6, a 5, a 4, a 3, and not felt (a o). If you were doing the 5-4 isoseism, for example, you would want to draw it so the 5s were inside your isoseism and the 4s were outside.
Download Your Data
Click on this link to view and print a map put out by the Southern California Earthquake Center.
Pencil in Your Isoseisms
Now, have a look at the patterns of intensity reports (it might help to review the Modified Mercalli Intensity scale by clicking here). Start lightly penciling in isoseismic zones by enclosing all the areas around the epicenter (the star) with reports of 7. Then, try the area separating the 6s from the 5s.
You will start to notice some anomalous readings within a zone, such as some 4s and 6s well within an area dominated by 5s. You are trying for pretty smooth isoseismic lines, so don't feel obligated to zig your lines absurdly to cover one of these anomalies.
When you think about it, it makes sense that you'll have anomalous readings. The people calling in to report their experiences might have been in terrain where the seismic waves travel fast with lower amplitudes and, so, create less dramatic effects. Also, this is a subjective scale, dependent on people honestly and thoroughly reporting the kinds of things this scale is based on. Also, your experience of an earthquake depends (at lower intensities) on whether you are moving around or lying/sitting still or whether you're on the upper floors of a building or on the ground floor. So, you want to draw smooth isoseisms that express the general trend, not every anomalous reading. In other words, you want to draw in smooth curves, such that nearly all of the 6s are inside the line, and most of the 5s are outside the line. You are basically delineating regions that experienced different levels of intensity. You are trying for a gently curving, smooth set of isolines (zig-zags all over the place, looking like a politically gerrymandered map, is NOT what you want).
Completing the Map
When you're happy with your penciled-in isoseisms, go back over them, neatly, in darker pencil or ink (committing yourself). Now, label each of the zones, but don't use the Arabic numbers: Use Roman numerals. Roman numerals are used to make sure people don't confuse this with a magnitude reading, which uses Arabic numerals. So, 7=VII, 6=VI, 5=V, 4=IV, and 3=III.
Interpreting Your Results
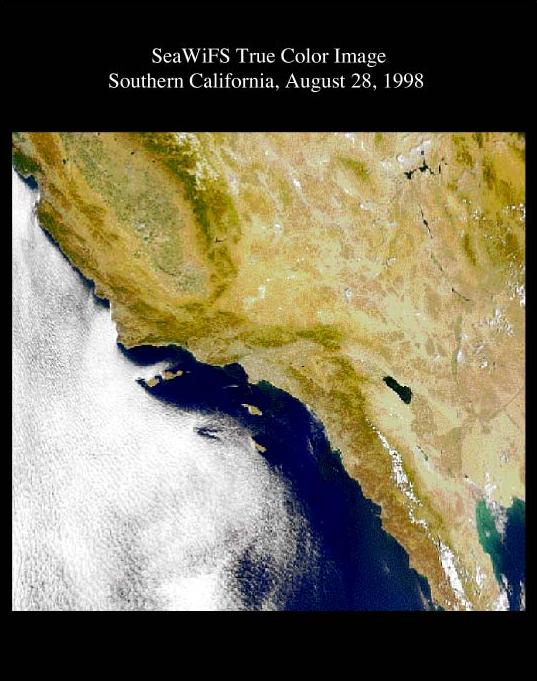
Look closely at your isoseisms. You'll find that they don't make perfect circles or ellipses: There are some concave and convex sections. Why might your isoseisms bulge away from the epicenter in some areas and toward it in others? Frame your answer in terms of earthquake waves and what happens to their speed and amplitude as they cross into different media (lecture 33, section E.3.c.iv.). It might help if you looked at an image of regional topography, such as this one from NASA's SeaWiFS Project.
Look at the exact location of the epicenter compared to Zone VII. How would you characterize that location relative to your isoseism? What is odd about its relative location? It might help you to look at this diagram of epicenter and focus and then apply a bit of geometry. Oh, what kind of fault is shown here?
![[ image of the relationship between epicenter and focus of an
earthquake ]](http://geology.wr.usgs.gov/docs/parks/deform/eqepifoc297x164.gif)
The fault that produced the North Palm Springs quake dips about 45° to the north and the focus was about 10 km down. Given that information, about where would you expect the fault plane to intersect with the surface (north or south of the epicenter -- brownie points for guessing how far away)? This might help you visualize and explain why the epicenter is so eccentric with respect to the isoseism bordering the VII zone.
Now, having considered these issues and the evidence, write a brief report answering the following questions:
- Why might the isoseisms form a wavy pattern, bending closer to the epicenter in some areas and away from it in others? Think in terms of the kind of ground found in various areas and how earthquake waves behave in these kinds of areas: mountainous or flat valley bottoms with their deep alluvial deposits.
- Why is the epicenter not right in the middle of the VII zone?
Document maintained by Dr.
Rodrigue
First placed on web: 11/26/98
Last revision: 03/23/03