Objective
The objective of the tutorial is to become familiar with the basics of Agilent ADS software.
Part 1 Start ADS software:
ADS software has been installed in every computer in dedicated laboratory. Just double click the ADS icon on desktop, or follow “Start à Programs Advanced Design Systems 2008 "Advanced Design System". Then ADS software will start. The “ADS Quick Start” in “Getting Started with ADS” window may help you understand some basics of ADS software. Please do read through.
In ADS, we will create new projects. Projects are saved as a folder in designated location. Each project could be composed by several designs. These designs could be simulated individually or together as a system.
Once you read through the ADS Quick Start. You may close the “Getting Started with ADS” window.
Part 2 Simulate a RLC circuit
Download “Project1_RLC.rar” from beachboard. Extract the folder to your own saving media. From ADS main window, use FileàOpen project to open the just saved Project1_RLC. (note: if a blank design window pops up after you open the project, just close it) This project should contain a design called “rlc1.dsn”. Double click it to open the design. The design should look like this.
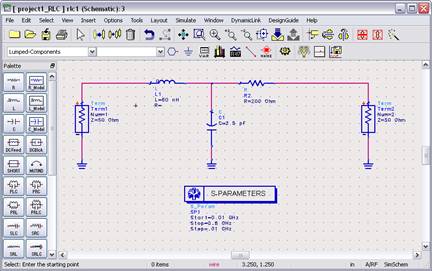
Download “Project1_RLC.rar” from beachboard. Extract the folder to your own saving media. From ADS main window, use FileàOpen project to open the just saved Project1_RLC. (note: if a blank design window pops up after you open the project, just close it) This project should contain a design called “rlc1.dsn”. Double click it to open the design. The design should look like this.
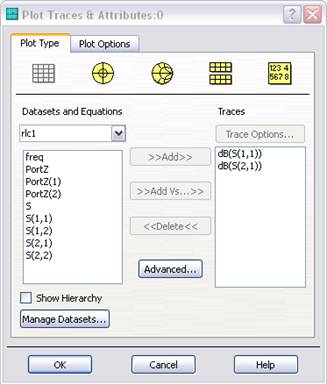
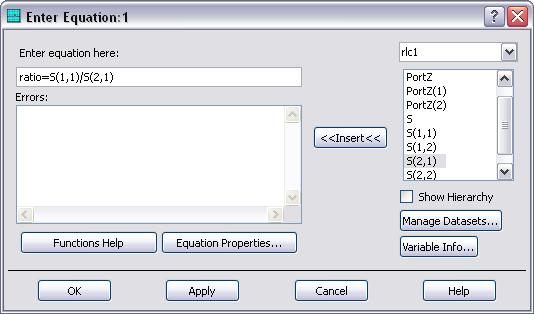
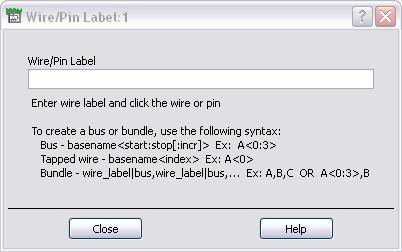
Now, click the gear
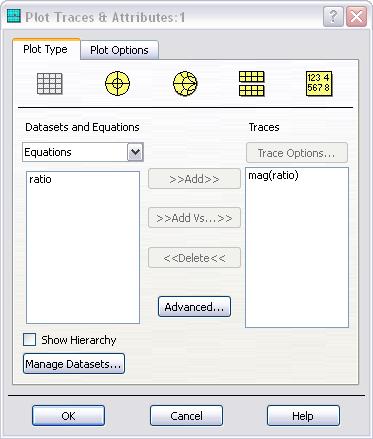
Select DataSet -> S(2,1) -> Add -> dB
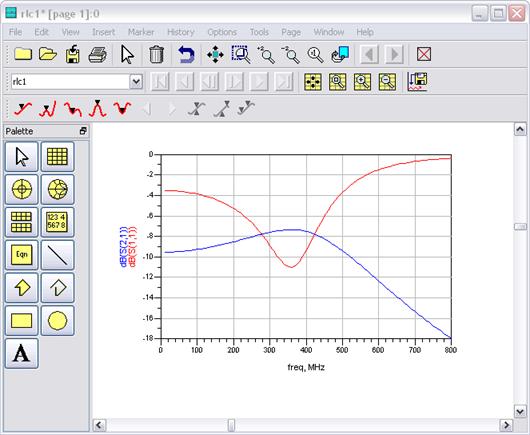
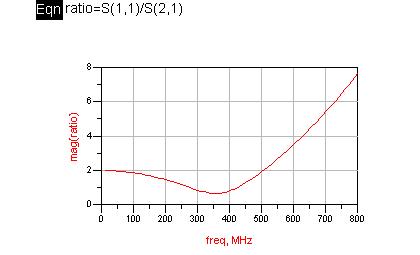
The screen should appear as:

Therefore, S11 is the ratio V1- /V1+ àReflection coefficient at port 1. S21 is the ratio V2-/V1+ à Gain of the system.
Print this and turn it in. ( plot 1 )
In RLC project simulation, please explain why maximum gain happens when reflection at port 1 reaches minimum. What is the difference between an ADS Project and an ADS Design? Explain S-parameter simulation controller. When it is used, for what?List some other simulation controllers ADS provides, briefly state what they are used for. Part 3 Build a transmission line transient design
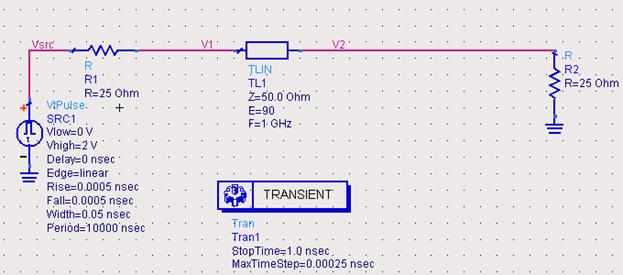
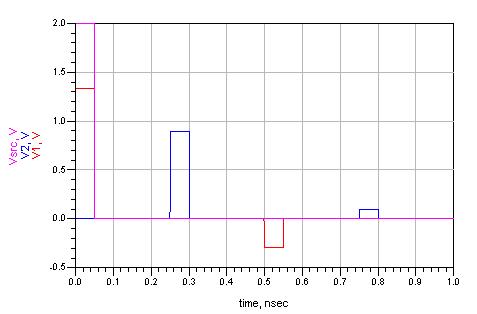
Select DataSet -> V2 -> Add
Select DataSet -> Vsrc -> Add
Your plot should look like this:
(Save part 3 in your thumb drive, you will need the result to answer questions in project 2)