 |
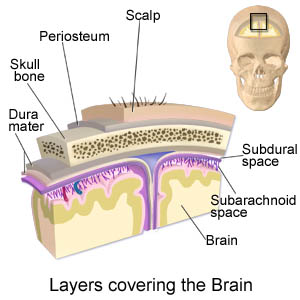
| Detail of the scalp from http://www.drugs.com/cg/images/en2476000.jpg |
Electroencephalogram Lab
For this lab you should read the text below and the linked articles on PET-based research. Then go to Beachboard and take the quiz for the lab.
Introduction
EEGs or Electroencephalograms are not "brain scans" in the sense of an imaging technique. EEGs were, nevertheless, one of the first ways of non-invasively observing human brain activity, and remain in use today. An EEG device records electrical signals from the brain, specifically postsynaptic potentials of neurons, through electrodes attached either to the subject's scalp, subdurally (i.e., beneath the dura matter; the outermost, toughest and most fibrous of three membranes covering and protecting the brain and the spinal cord), or even on the cortex itself (these later two cases are relatively rare). Like EKGs (electrocadiography), EEGs are based upon the theory of volume conduction of ionic current through non-empty extracellular space. The recording is obtained by placing macroelectrodes on the scalp, usually after some abrasion and with a conductive gel to create a better contact. The measured EEG activity is the sum of all the synchronous activity of all the neurons in the area below the electrod that have the same approximate vertical orientation to the scalp.
|
| Detail of the scalp from http://www.drugs.com/cg/images/en2476000.jpg |
A Brief History
Towards the end of the ninetieth century researchers were trying to study the electrical properties of the brain. In 1875, a surgeon from Liverpool, England, Richard Caton (1842-1926), measured electrical potentials of the exposed cortex of rabbits and monkeys. The Polish physiologist, Adolf Beck (1863-1939) made similar recordings in 1891, as did some Russian scientists. In 1912, the Russian physiologist Pravdich-Neminski (1879-1952) published a paper which presented a photographic record of the electrical activity of the brain. An Austrian psychiatrist named Hans Berger was the first to record this activity in humans, in the late 1920s. The driving idea behind much of Berger's work was locating a correlation between objective activity of the brain and subjective psychological phenomena. Berger took measurements of electrical activity above skull defects with the Lippman capillary electrometer (Gabriel Lippman, 1845-1921) in 1902. He also used the Edelmann galvanometer, but found neither measurement satisfactory. Berger continued his studies on electrical activity in human brain and in 1924 made the first EEG recording of a human (Electroencephalogram).
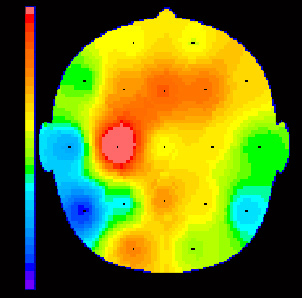
Also of note is the contribution of an English physician Walter Grey. In the 1950's Walter developed EEG tomography. EEG tomography provides a means for mapping electrical activity across the surface of the brain. EEG tomography gained prominence during the 80's primarily as a imaging technique in research settings.
|
|
|
 |
|
|
Hans Berger (1873-1941) |
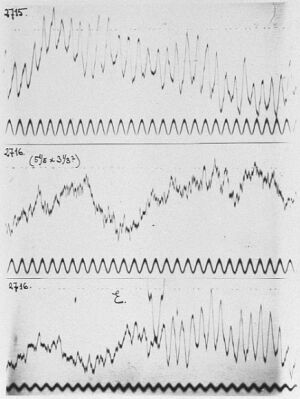
Recordings of EEG made by Berger |
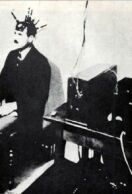
Patient of Berger Photos Courtesy |
Image Generated by EEG tomography Image Courtesy |
What Do EEG Machines Detect?
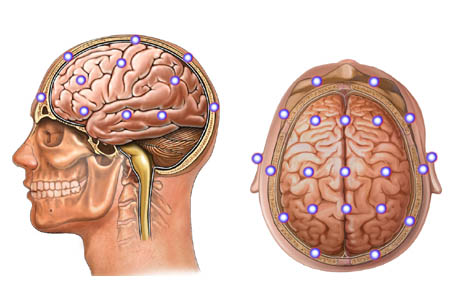
The EEG detects the summed ionic currents of thousands of pyramidal neurons beneath each of the 16 and 25 individual macro electrodes, and reports them as voltage differences across low resistance extracellular space. Specifically, the potentials recorded by the macroelectrodes on the skin of the skull are primarily generated by extracellular current flow of synaptic potentials in pyramidal cells. Action potentials of the neurons are usually asynchronous and too fast-moving to generate detectable potentials on the skin's surface. Brain cells other than pyramidal neurons such as interneurons and glial cells make relatively little contribution to skin potentials because, unlike pyramidal neurons, these cells are neither oriented in parallel to one another nor do their dendrites run perpendicular to the cortical surface. In contrast, pyramidal neurons run parallel to one another with large dendritic branches that run perpendicular to the cortical surface.
 |
 |
|
Computer generated image of a pyramidal neuron from CA3
Image courtesy |
Points for placement of macroelectrodes in EEG.
Image copyright 2000 by Nucleus Communications, Inc. All rights reserved. http://www.nucleusinc.com |
How Do EEG Machines Work?
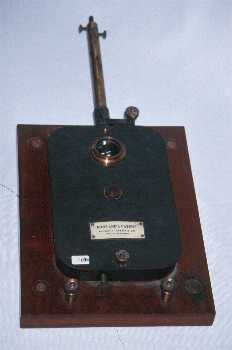
The macroelectrodes attached to a subject's scalp transmit electrical signals to the EEG machine, which acts as both an amplifier and as a galvanometer. The signals relayed to the EEG are typically amplified 10,000 times. Galvanometers are instruments that detect and measure small electric currents by means of a copper hoop or coil of wire that deflects a needle proportionate to the current flowing through the coil. The galvanometers are in turn hooked up to pens, which trace the electrical signals on graph paper moving continuously underneath them.
EEGs allow researchers to record electrical impulses traveling across the surface of the brain and observe changes
to those impulses. EEG recording have two useful features.
First, they make continuous recording with split second accuracy. Second, EEGs can
indicate the general conscious state of a person, e.g., asleep, awake, anaesthetized,
since each state is correlated with particular EEG patterns. Thus, EEG
recordings have been used measure the time it takes the brain to process various stimuli.
EEGs are also used to assess brain damage, coma, mental retardation, encephalitis, cognitive impairment, brain tumors,
and epilepsy. EEGs are also used in sleep research.
Nevertheless, the usefulness of EEGs is limited in that they do not reveal brain structures
or anatomy, nor can they indicate the functioning of specific brain structures.
 |
 |
 |
| An old and bulky Galvanometer
Photo courtesy of Kenyon University Physics |
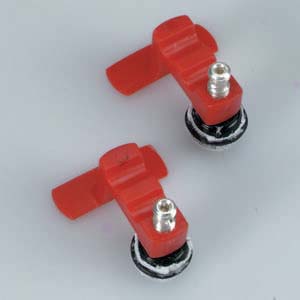
Typical Macroelectrode
Image courtesy |
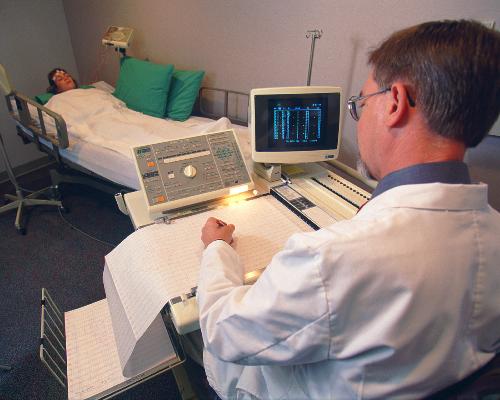
EEG machine in action
Photo courtesy http://www.wfubmc.edu/neurology/department/diagneuro/eeglab.html |
Brain
Wave Types
EEGs record brain waves. Brain waves are all oscillating electrical voltages in the
brain measuring just a few millionths of a volt. There are four widely
recognized brain waves, though there isn't complete agreement on frequency
ranges. Alpha waves, were discovered by Berger. Alpha waves oscillate
at a rate of approximately 10 times per second, and the range is 8-13 cycles per
second (8.5 to 12Hz). These waves appear around the second year of
life and are associated with relaxed alertness in adults. Beta waves range
from 13 to 40 cycles per second, (i.e., 12 Hz and above). Beta waves are
associated with active or anxious thinking and active concentration. Delta
frequency range up to 4 Hz. Psychologists often associated Delta waves with the very young and
with certain encephalopathies and underlying lesions. Delta waves are also
sometimes seen in combination with other waves during sleep. Finally, the
range of 4.5 Hz to 8 Hz is called Theta waves. Theta waves are
thought to be characteristic of drowsiness, childhood, adolescence and young adulthood.
Theta waves can also be induced by various methods: hyperventilation, trances,
mediation, hypnosis, deep day dreams, lucid dreaming and light sleep and
immediately prior to falling asleep and waking up.
Articles on EEG (Read before doing quiz)