Lawrence Fujiwara – Analyzing historic Hoouluia heiau through UAV imagery and OBIA methodology
Contents
[ hide ]
Analyzing historic Hoouluia heiau through UAV imagery and OBIA methodology
Lawrence Fujiwara California State University, Long BeachIntroduction
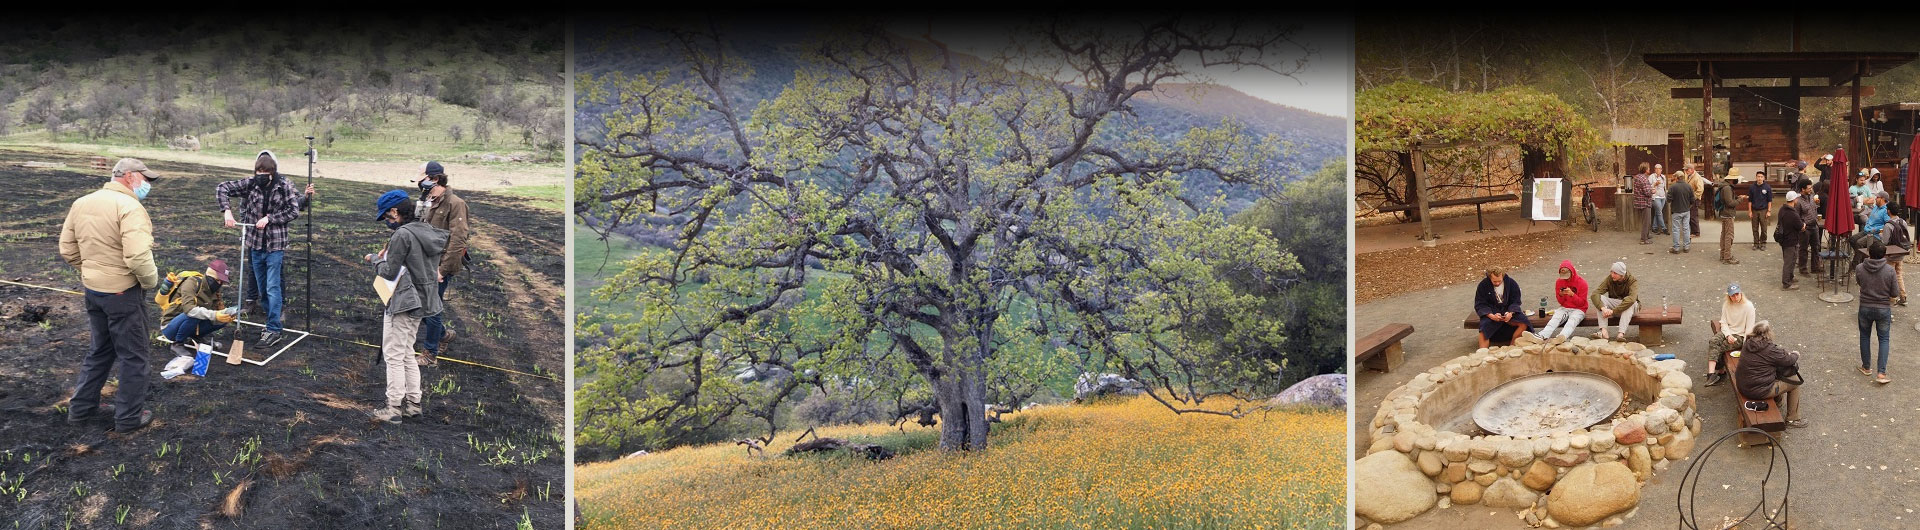
The purpose of this research was to find a way to detect and define archaeological structures by analyzing and observing patterns in the scale of individual rocks using remote sensing techniques. The focus of this approach is a Heiau located on the southeast coast of Kauai (Figure 1). I investigated the ability to use remote sensing techniques to quantify differences in the structure of rocks used to build this archaeological feature. 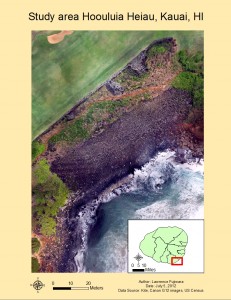
Figure 1. Location of the study area
Methods
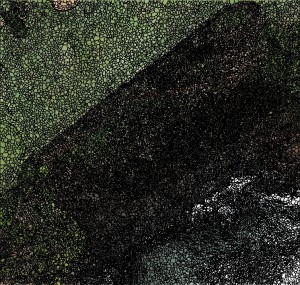 Figure 2. eCognition segmentation of the heiau.. Scale parameter 10, shape 0.3, compactness 1.
 Figure 3. Map of hillshade and contour lines of the heiau created from the LIDAR data.
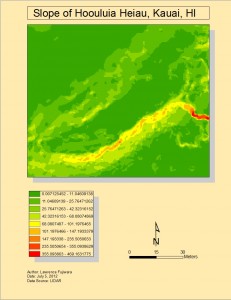
Figure 4. Slope of heiau created from the LIDAR data.
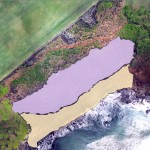 Figure 5. Digitized layers of both flat and sloped area . Both are separate layers and 15% transparent.*While digitizing I made the slope and aerial image of the heiau transparent. I also made sure not to include vegetation and rocks that are not part of the heiau.
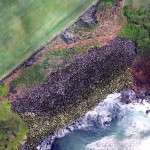
Figure 6. Screen shot of the two layers after select by location with the polygons produced from eCognition.
Results
With the merged layers of both flat and sloped area, there was a definite pattern in the heiau. The rocks on the flat area of heiau had smaller surface area (sq.meters) (Figure 7).
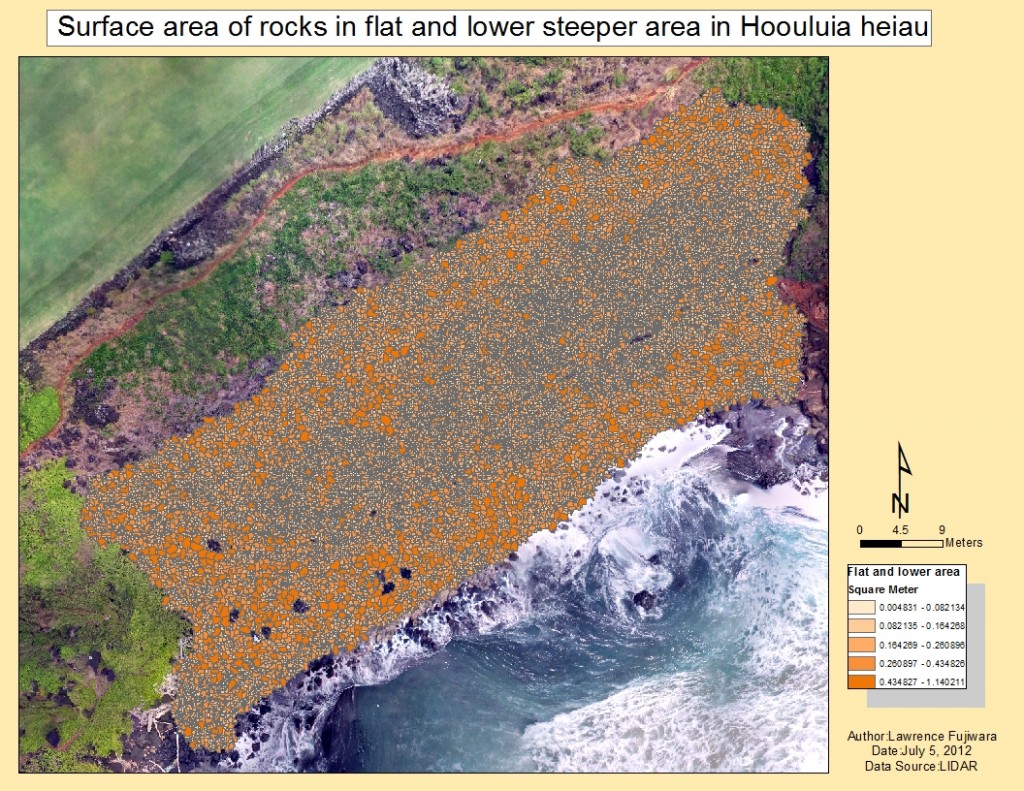
Figure 7. Map of surface area of both flat and sloped . The flat and lowerslope polygons were merged. The values are in square meters.
The results of the sample t-test which compares the mean score of flat and sloped area showed that compactness, brightness, elliptic fit, density, radius and surface area were all highly significant at the 0.05 significant level. However it was not significant in the direction. (Table 1 and 2).
This confirms rocks in the flat and sloped area are quite different in many ways.
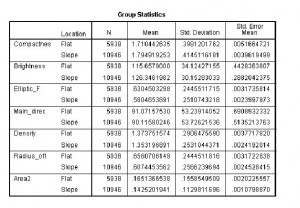
Table 1. Statistic outputs of IBM SPSS
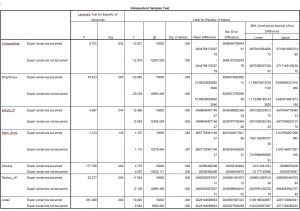
Table 2. Statistic outputs of IBM SPSS
Conclusions
The result of this analysis suggests that the larger rocks found on the slope maybe part of the internal composition of the deteriorating heiau due to natural causes. More research needs to be done on other heiaus and/or other archaeological structures. With more data on the patterns of rocks, size of rocks, etc of other archaeological structures, it could be possible to define an archaeological feature.
Biases and Limitation
Acknowledgements
I would like to thank Dr. Suzanne Wechsler, Dr. Carl Lipo, Dr. Christopher Lee of California State University, Long Beach; Dr. David Burney and Lida Burney of the National Tropical Botanical Garden; Paul Nesbit, Briton Voorhees, Mike Ferris, Jacob Kovalchik, Matt Lucas, Ted Ralston, Chuck Devaney, David Hummer, John O’Conner, Samantha Hauser and Avery Sandborn.
This research was made possible by the National Science Foundation, Research Experiences for Undergradutes Program NSF Award #1005258 Geospatial Research and mapping(GRAM)