colorful progression
June 27, 2012Every time that I collected a water sample, I also took a GPS waypoint with a Garmin. I projected these points onto an annual rainfall raster layer overlain by a watershed polygon layer, as well as a layer with all of streams on the island of Kauai. A rough draft of this map follows…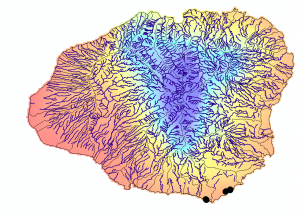
I plan on adding the GPS points from when I collected samples from our fishing boat excursion. Also, I will visually display the water chemistry of each sample by using a Piper Diagram. I color coded a Piper Diagram that I will use as the key in my final map product.
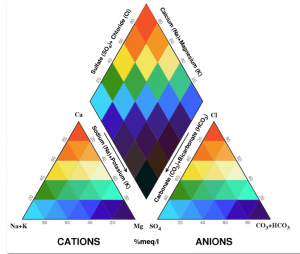
Once I run my water samples through the ion chromatographer, I will be able to visually display the results by plotting the chemicals in each sample on this diagram. Each sample will have a point on the two triangles and the parallelogram. The dot will fall within three unique colors. These colors will represent the corresponding point on the map.